 As a project of the King County Cities Climate Collaboration with technical assistance from the Smart Buildings Center, the City of Bellevue recently took the step to benchmark municipal buildings and publicly disclose the data in order to be more transparent with government data and measure progress towards its energy goals.
In November of 2016, the City of Bellevue passed Resolution 9186 authorizing annual benchmarking and reporting of energy use in select municipal facilities over 5,000 square feet. Energy benchmarking is the process of measuring and tracking a building’s energy use over time. Bellevue is using EPA’s free online tool called Portfolio Manager to benchmark it’s buildings. Building square footage and total annual energy use are used to calculate the Energy Use Intensity (EUI) for a given property. You can think of the EUI as a miles per gallon for your building – a lower EUI means the building is performing more efficiently, while a higher EUI may mean there are opportunities for improvement. It is also important to note that some facilities may have a high EUI as a result of being a more energy intensive property use, like a pool or a data center.
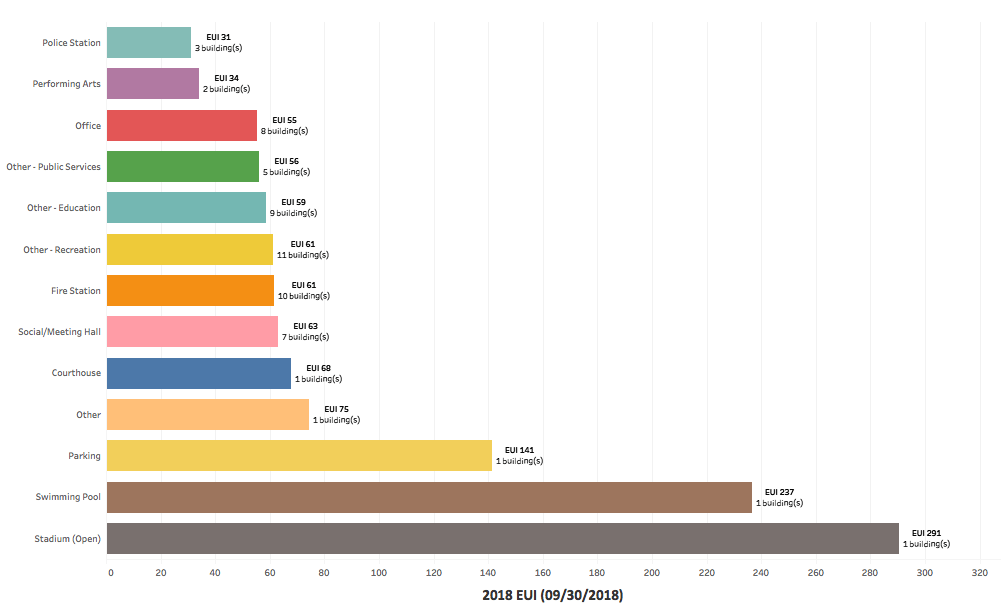
Resolution 9186 allows for this information on select municipal facilities to be available to the public. Below is a histogram detailing the range of EUI results and the number of municipal buildings that fall into each range.
Energy Use Intensity (EUI) of All Buildings
City of Bellevue Benchmarking Details – Q3 2018
In the table below, you will find more detailed results on individual municipal buildings as well as a comparison to mean values from similar municipal buildings in the City of Seattle. The percent change column identifies the difference in EUI comparing year over year results. You will also find the Seattle percent difference to compare performance results of similar buildings in Seattle and Bellevue.
| Property Name | Building Type | Square Footage | 2016 EUI2 | 2017 EUI | 2018 EUI (09/30/2018) | 2017% Change1 | 2018% Change1 | Seattle EUI2 | National Median EUI3 |
|---|---|---|---|---|---|---|---|---|---|
| Bellefield Courts Building | Courthouse | 29486 | - | 70 | 68 | - | -3% | - | 50 |
| Bellevue Aquatic Center Building | Swimming Pool | 26219 | 239 | 210 | 241 | -14% | 13% | 317 | 55 |
| Bellevue Botanical Garden- New VisitorCtr | Other - Public Services | 5650 | 91 | 86 | 78 | -6% | -10% | - | 39 |
| Bellevue Service Center | Office | 127753 | 76 | 74 | 72 | -3% | -3% | 58 | 63 |
| Bellevue Youth Theater at Crossroads | Performing Arts | 12257 | 36 | 41 | 41 | 12% | 1% | - | 27 |
| City Hall | Office | 391839 | 57 | 50 | 46 | -15% | -7% | 78 | 111 |
| Crossroads Comm Park ~ Center Bldg. | Social/Meeting Hall | 21052 | 57 | 74 | 68 | 23% | -8% | 70 | 45 |
| Driving Range | Other - Recreation | 9025 | - | 39 | 37 | - | -5% | - | 31 |
| Station 1 | Fire Station | 15700 | 51 | 54 | 55 | 5% | 3% | 97 | 62 |
| Station 2 | Fire Station | 11258 | 76 | 84 | 71 | 10% | -18% | 97 | 75 |
| Station 3 | Fire Station | 16463 | 41 | 40 | 40 | -3% | 0% | 97 | 71 |
| Station 4 | Fire Station | 6751 | 72 | 73 | 61 | 2% | -21% | 97 | 73 |
| Station 5 | Fire Station | 5022 | 78 | 74 | 64 | -6% | -15% | 97 | 75 |
| Station 6 | Fire Station | 6110 | 58 | 55 | 56 | -5% | 1% | 97 | 72 |
| Station 7 | Fire Station | 5630 | 80 | 84 | 80 | 5% | -5% | 97 | 75 |
| Station 8 | Fire Station | 9132 | 60 | 57 | 51 | -6% | -11% | 97 | 73 |
| Station 9 | Fire Station | 7838 | 59 | 49 | 41 | -20% | -21% | 97 | 59 |
| Highland Park ~ Community Center | Social/Meeting Hall | 22805 | 63 | 72 | 62 | 12% | -15% | 70 | 40 |
| Ivanhoe Elementary School Buildings | Performing Arts | 9430 | 56 | 49 | 28 | -14% | -77% | 61 | 41 |
| Lewis Creek Park | Other - Education | 5130 | 111 | 106 | 100 | -5% | -6% | 70 | 60 |
| Lincoln Center rental | Office | 41191 | 58 | 57 | 42 | -2% | -36% | - | 47 |
| Mercer Slough - Environ Ed Center | Other - Education | 11554 | 72 | 64 | 60 | -13% | -6% | 70 | 71 |
| North Bellevue Community Center | Social/Meeting Hall | 17820 | 90 | 93 | 87 | 3% | -6% | 70 | 39 |
| Old Safeway site | Other - Public Services | 16000 | 17 | 15 | 5 | -14% | -219% | - | 32 |
| Public Safety Training Center Stn 10 | Fire Station | 7022 | 68 | 55 | 100 | -24% | 45% | 63 | 39 |
| Robinswood Comm Park - Tennis Center | Other - Recreation | 27687 | 86 | 80 | 86 | -7% | 7% | 70 | 49 |
| South Bellevue Community Center | Social/Meeting Hall | 34917 | 56 | 57 | 58 | 3% | 1% | 70 | 59 |
- For all ‘% Change’ columns, a negative value represents less energy use per square foot when compared to the year prior. For ‘Seattle % Difference’ and ‘National % Difference’ columns, a negative value means that the City of Bellevue’s 2018 EUI is performing better than the respective EUI from Seattle and the National Median.
- City of Seattle, Office of Sustainability and Environment. “Seattle Municipal Buildings: 2013-2014 Energy Performance Report” Seattle.gov Office of Sustainability and Environment. N.p., Sept. 2015. Web.
- Energy Star. “U.S. Energy Use Intensity by Property Type.” Energy Star Portfolio Manager. N.p., Mar. 2016. Web.
To compute the national site energy median levels of performance, Portfolio Manager uses the fuel mix associated with the property’s current energy use.
Download the full report ( MS Excel)

